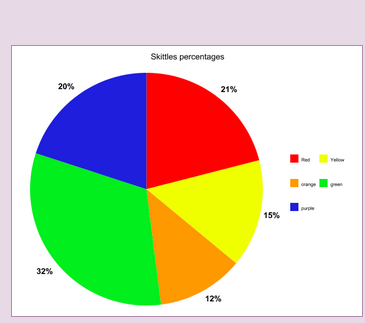
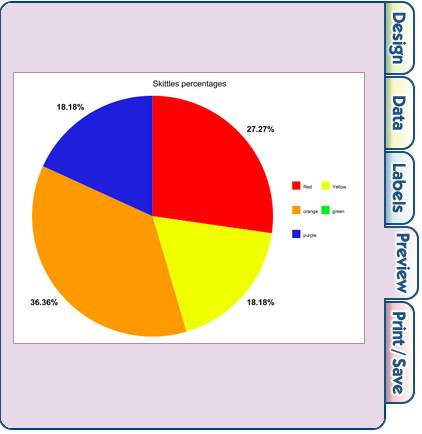
Today in math my class were learning about pie charts we used skittles as our example we were trying to figure out how meany skittles were in a bag so we did a sample we got 10 skittles we had to count how meany red,yellow,orange,green and purple skittles we had I got 3 red ,2 yellow, 3 orange,0 green,and 2 purple. Then I turned it into percents for my percentages I got 30 for red, 20 for yellow, 30 orange, 0 green and 20 purple, after that we did a class sample we got 21 red, 15 orange, 12 orange, 32 green, 20 purple then we figured out that a class sample is better to work with cause its more accurate here is a pie chart of both of my information
 RSS Feed
